
SEO Tests are experiments made with a methodology that determines with a certain confidence how probably a variant is better to rank on Google over others
They are the new market trend and, just like every trend, some things are just fashion and buzz words, while other things are revolutionizing the way we do SEO. In this article I want to talk about the things I bet will not change over the next few years.
I’m really excited about a lot of great content that has been recently published about SEO Testing, but today I’ll share something different with you. It’s a proprietary framework we created at Conversion, the largest SEO Agency in Brazil, to run SEO tests with low code requirements, focused on content and user experience.
I’ve been applying this methodology for the last 3 years and it has worked very well. Now, I would like to share and spread the techniques we’ve developed. To demonstrate the reliability of these experiments, I started a new project in late December 2021, implementing and documenting almost all of my experiments (I ran over a hundred tests). The results were amazing! Our organic search traffic increased about 150% in just four months.
So what’s the secret behind this impressive outcome?
Most SEO Experiment Methodologies and tools I’ve seen are usually based on Technical SEO. This is great, however in Brazil, and I suppose in other places, it’s usually hard to implement simple SEO technical changes.
In response to this challenge, I developed a framework where you can create great tests by CMS or Google Optimize. It’s simple, but not easy.
What is SEO Testing?
SEO Testing is experimentation using a methodology that determines, with a certain level of confidence, the probability that a variant ranks better on Google Search Results over others. There are two main goals to run SEO tests: first is the results itself and the second, and most important, to generate knowledge that drives innovation.
An important aspect of SEO Strategy is the knowledge and data you have about your organic search results and how the algorithm works. To obtain all this information, an important source is running SEO Experiments, because the results (positive, negative or neutral) will generate learning, which make it possible to create more assertive optimizations and scale your organic traffic.
If you have a very small website, maybe there’s not a lot of testing to be done (but there is some testing!). On the other hand, even if your site is still small and you want to receive exponential organic traffic, SEO Testing is for you!
Search Engine Optimization (SEO): recapping the basic principles to put experiments into practice
Before we begin to unpack the methodology of experiments, it’s important to make sure that we’re all on the same page.
Anyone who has read Google’s quality guidelines, an important document for SEO professionals, knows that there are extremely rich insights there. One of them is the concept of E-A-T: Expertise, Authority and Trustworthiness, which is based on what Google expects sites to offer users.
According to Google Search Quality Evaluator Guidelines, Expertise is exemplified by being a reference and having depth. In regard to Authority, Google suggests that a site or brand be recognized by others. Often this is related to who signs an article and other times to how that site is mentioned by others and how it receives backlinks. A high level of Trustworthiness is attained by security seals, HTTPS certificates, Google certifications, professional design etc.
Let’s go on to the main ranking factor today: search intent, which is less about the string used on search engines and more about what’s on the user’s mind, even if it’s not explicit.
The third principle we need to reinforce is user experience, which is about making sure that every touch point the user has with your brand generates a positive experience, or at least, a neutral experience. Keywords play a lesser role than User Experience in SEO today.
Attraction, retention and conversion
Today, SEO is increasingly connected with brand building and all marketing channels.
Don’t think of SEO, paid media or any other channel independently, because only marketers distinguish channels, but your users and clients don’t. It’s necessary for all channels to be coordinated in order to create a funnel or a consumer journey.
They can be in any point on that cross-channel (omnichannel is better!) journey: paid search, organic search, social networks, and so on.
The first aim of SEO strategies is to generate attraction: to achieve visibility at the top of searches and to get clicks.
This is the initial kick, but many professionals continue to focus only on attraction. My experiments show an enormous correlation between time spent on site and higher ranking.
So, even though attracting users today is essential, developing retention strategies is far more important! Why? Because not only will it transform visitors into clients, but your site will rank higher in search results. To be clear, your site has to make people spend more and more time, and come back.
This is a maxim in the Growth market, which understands that growth is retention. In other words, a company does not increase its revenue by selling to more people, but by selling more to customers who are already part of its base. The goal here is always to increase the customer’s lifetime value.
Adapting this concept to SEO, we can conclude that your site should always offer a next step to retain your visitor, it doesn’t matter if it’s the first or the eightieth visit. These next steps we can call micro-conversions.
Micro-conversions
If users don’t bounce from your website, it’s natural to think that the next step is conversion. This can mean different actions for different types of business – ranging from turning your visitor into a Lead, to leading them to finalizing a purchase on transactional sites.
Between one point and the other, we can work on small goals that will make the path to the final conversion clearer: micro-conversions.
Because there are complex correlations between steps of a funnel, getting significant changes in your overall website conversion rate shouldn’t be your main goal or you can become frustrated. It’s often hard to find a correlation between a new button color and generating more sales, but it might be easier to see a correlation between changing a button color and products added to the user’s cart (which is a micro-conversion).
In these cases, working with micro-conversions is a more effective strategy. You shouldn’t focus so much on the final step, but rather on taking your user step by step from the beginning of their purchase journey to the end.
In other words, working with micro-conversions is about getting your user to go to the next step every time. And by leading them little by little, you will be able to optimize all the points that lead the consumer from their first access to their return.
Some great goals for micro-conversions are:
- Get the customer to add products in the cart
- Page scroll rate from 50% to 80% (a great goal for content)
- Access a specific page within the site
- Increase time on page and then visit duration
- Reduce bounce rate
- Lead conversion for e-books, rich content, mail lists, etc.
Now that we’ve the basic principles down, let’s get to know the tools we’ll use to conduct our SEO tests.
SEO Tools for Experiments
The main tool we’ll use is Google Search itself.
It’s through SERP (Search Engine Results Page) that we will analyze the competition and follow the positioning of the keywords we work with.
Although there are other tools that track organic keyword positions, it’s by analyzing the SERP that we can acquire more depth and experience.
The second tool is Google Analytics, ideal to better understand the behavior of your user and get some metrics that we’ll use in our experiments.
Moving on to less popular tools, heatmaps are fundamental to the analysis of the SEO Experiment Methodology described in this article. To get user interaction metrics (like clicks, hover mouse and page scroll) and evaluate heatmaps, you can use any of these three tools: Microsoft Clarity, Hotjar or PageSense.
To extract navigation data, we use Google Search Console (formerly Webmaster Tools), SEMRush to measure potential traffic, and Google Optimize to perform A/B tests.
Key metrics
Whatever type of experiment you are going to conduct, some evaluation metrics are fundamental for you to be able to “prepare the ground”.
Below we will discuss the principal metrics available through the tools mentioned above.
The first of these is the heatmap.
Heatmap: What is it and why is it important?
Heatmaps offer user behavior data from one or multiple pages and with them you can do interesting types of analysis.
The first data available to analyze is the percentage of users who scrolled, or just “scroll”.
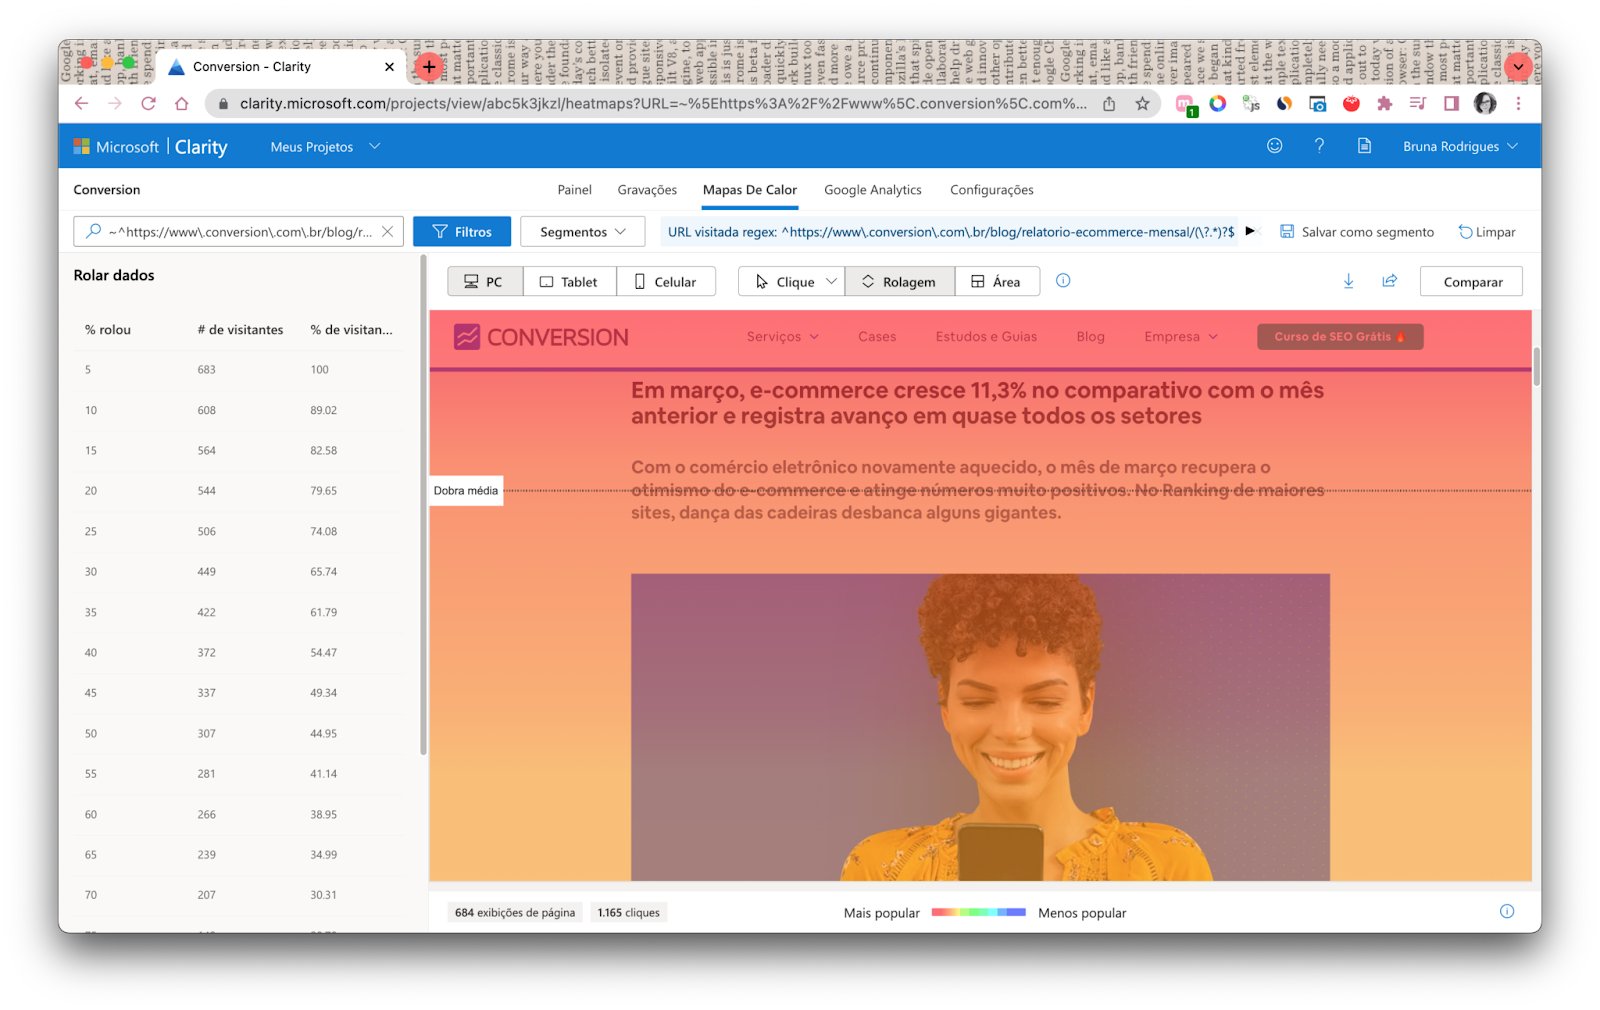
This is very rich data because it shows at which points interest in your content starts to wane and the user bounces. Something important to consider is that it’s a metric that can’t generate many conclusions without considering other metrics.
In addition to the scroll heatmap, the tools offer click maps. They show on which parts of your page there are more clicks and mouseovers, and a map of most clicked areas.
To make better use of the metrics, it’s important to put them into another context and do what we call Retention Analysis here at Conversion, a very important concept to apply the methodology of experiments especially for content optimization.
Retention Analysis
To perform retention analysis, you first need to divide your content into sections.
We will illustrate this below.
In the first column of our worksheet, get your free copy here, we will divide the Sections into “Cover”, “Introduction”, etc.
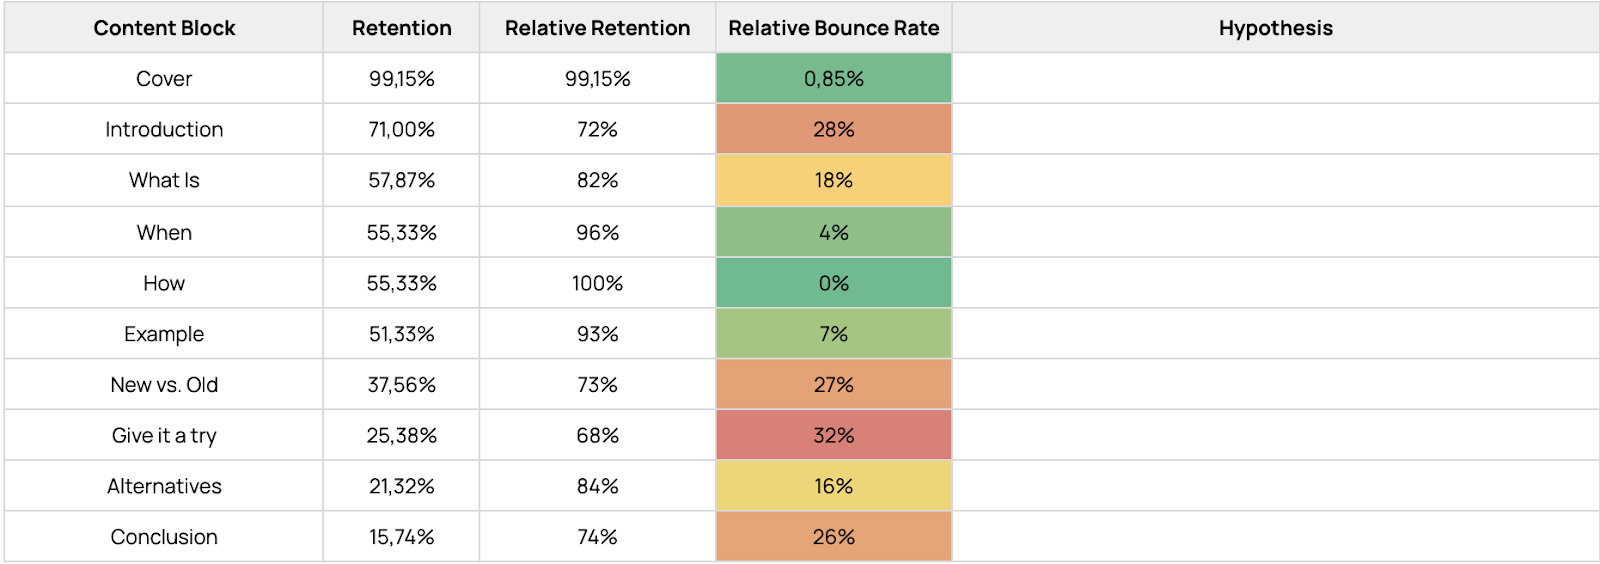
In the second column, Retention, we will put the retention rate, data generated by a heatmap tool like Clarity. Then, in the third column, we calculate the Relative Retention, which shows the real retention of users in each content block (it’s calculated by comparing to the previous block). The fourth and most important column is Relative Bounce Rate, which shows where you’re really losing your users!
Thanks to the analysis of the retention spreadsheet, we conclude that the “Give it a try” block is the block that retains the least users.
And with this data, we can test variants to improve retention on this page. Next to Relative Retention, we also have a fifth column, the Hypothesis column. This column is reserved for what you could do and how you could improve the content or user experience.
Developing hypotheses about why certain blocks bounce more than others is an important exercise in analysis, especially when we try to look at the content from the user’s perspective.
This exercise allows us to develop a more analytical and in-depth look at the content evaluated and published.
Retention Analysis is a key point that differentiates our methodology from the way the market usually analyzes and executes SEO experiments. In general, they create page control groups where structural changes will be compared with one or more variants. This model can generate some excellent results, but usually it’s highly complex to implement from a technological point of view.
In the next few topics we will effectively go into how to run SEO tests and how to manage your experiments so that knowledge sharing is enhanced by the methodology itself.
How to conduct and manage SEO Experiments
When conducting an experiment, or more than one simultaneously, it’s important to have a good management scheme to organize them. We’ve chosen the kanban scheme managed with Notion. See below an example of how you can categorize the board according to the method we use at Conversion (make your free copy here!).
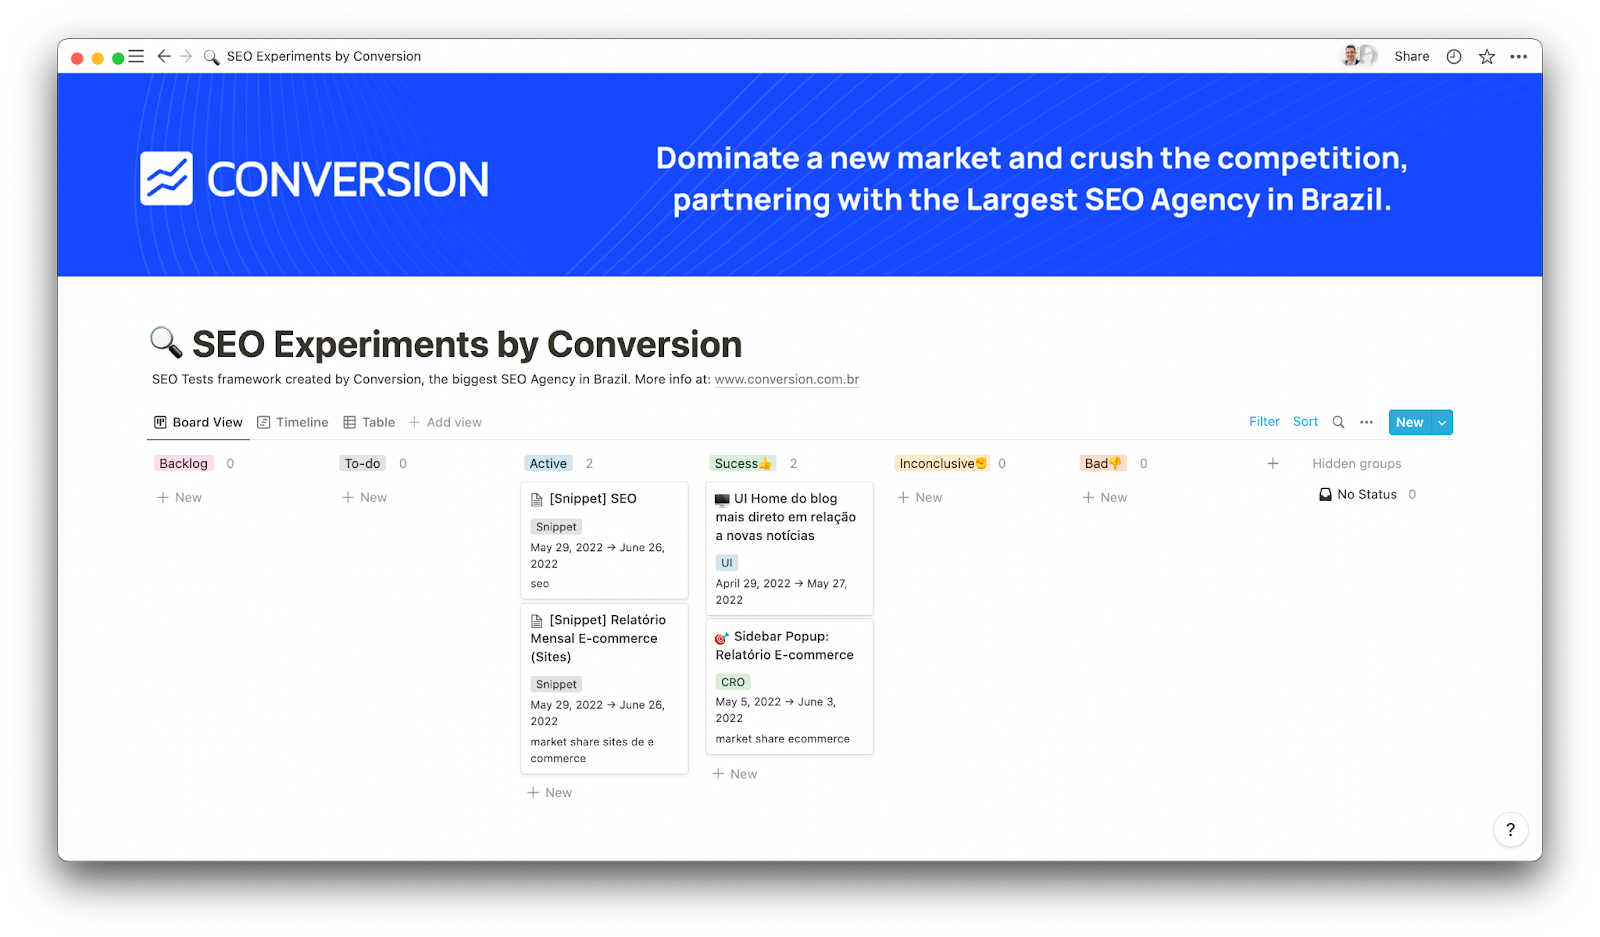
In the Backlog column we’ve got the experiments that are still at the idea level. Then, when they’re already structured and planned, they’re moved to the To-do column. Next, the experiments that are live are placed in the Active column, and when they’re finished they’re categorized as Success, Inconclusive or Bad.
For an experiment to work fully it’s necessary that the whole company embraces error culture. This is because most experiments will go wrong, and that’s okay! If there are no experiments going wrong, I can guarantee that the experiments are not being done correctly. But it’s not enough to make mistakes: you have to convert the error or the inconclusive results into learning.
Generating knowledge that stimulates innovation is the great goal of experiments, not only in SEO, but in all types of experiments.
How experiments work
To conduct an experiment correctly, it must be embedded in a scientific methodology and have or generate data to support the hypothesis that will be raised.
It’s very common for SEO professionals of all levels of experience to conduct experiments, large or small, in their day-to-day work. It’s also very common for these tests to be done empirically, without the help of any methodology.
While there is nothing wrong with testing empirically, conducting experiments in this way makes it more difficult for you to expose the results you achieve to others, share the process with your team, analyze the results based on data, and confirm your hypotheses.
To run reliable tests you need to use a scientific methodology. I recommend following these simple steps:
Control: When creating an experiment, you need a control and a variant. A control is a version of your page (or group of pages) that will be compared to another version (or group). I usually use two kinds of control: when an experiment is created with Google Optimize, the tool itself sets the control. In other tests, as I usually have SEMRush traffic as KPI, my control page is another URL without experiments running.
Data: A good experiment generates data to be analyzed and critiqued by other people in your team. So good quality data is absolutely necessary and you should never create tests if any KPI isn’t defined and measured during the test. I usually work with 2 KPIs and expect a positive result for both so I can determine if the experiment was successful.
Hypotheses: They’re the most difficult part of an experiment, as they’re the core of the tests. A good hypothesis requires a good analysis of context and challenge, creativity, and be data driven. Here you set the change that will be tested, which may be different content, user interface, or remove some block of the page, etc.
The Case Method
Business schools introduced The Case Method as a very useful tool to learn and share insights about complex situations. I use its principles to run SEO Experiments, as it gives a simple and powerful procedure to create reliable knowledge.
In general, this method has three steps:
Challenge > Hypothesis > Results.
Challenge
The challenge is the problem you are facing. For starters, write this problem or context down in detail. Focus on the problem!
This problem should be something quite simple that you can test, such as a poorly positioned keyword, poor user experience, low retention, etc. Avoid very complex problems such as Core Web Vitals or technical structure (in these cases I recommend other approaches like SplitSignal or SearchPilot).
It’s important, however, that everything is very well documented and easy for everyone to understand. Remember that you’re not just creating tests for yourself, but promoting a culture of experimentation. Culture depends on engaged people.
Hypothesis
To proceed with the explanation, imagine, for example, a keyword that is ranked on the second page of Google. This is the problem, and how we can change it, is the hypothesis.
In this example, the hypothesis is that if this page receives 10 internal links, it will reach the first page and stabilize there for at least 14 days. Observe that we’re defining the data to be tested in the hypothesis (10 internal links) to obtain the result we expect (ranking on the first page for at least 14 days).
Another important point about having data is that in the future we can analyze and compare experiments themselves. For example, we could analyze the creation of 5, 10 or 20 internal links and which is most effective.
Here the comparative basis is the initial keyword positioning versus the positioning on Search Engine Results Page (SERP) after adding the internal links.
In addition to the main goal (getting to the first page of Google, in our example), we can also stipulate some secondary goals, which I highly recommend.
The secondary goals are useful, especially when used to track the evolution of the experiment. I usually have SEMRush Traffic as a secondary goal to be tested and tracked, especially because it’s not based on seasonality as Google Search Console data is. I suggest you avoid using Google Search Console or Google Analytics data if you’re not very familiar with testing!
When we have more than one goal in an improvement process, we protect ourselves from causal fallacies or confirmation bias.
Here’s an example: after an experiment, the traffic of an e-commerce page increased by 20%.
At first it might seem that the traffic increase happened because of the improvement tested by the experiment. However, there were external factors: it occurred during the week of Black Friday and the site was running a Black Friday campaign!
This means that the traffic increase may not have been caused by the test alone, but by a seasonal context that affected all e-commerce. If other secondary goals had been tied to the test and tracked and determined together, it would be easier to establish this correlation.
Results
The results reflect the validity of your hypothesis, which can be good, bad or even inconclusive.
Imagine that the page we are using as an example dropped even further to the third page of Google, after the 10 internal links were added.
This is the final result observed.
It’s time to analyze the data and metrics obtained during the experiment and determine what was learned from the whole process.
As said before, the experiment in and of itself is nothing. Apart from other contexts and analyses, it has very little value.
The most important thing, after the implementation of the method, is the knowledge and statistics generated.
When an experiment returns bad results, it’s important to answer a few questions. Why did this experiment go wrong? What can be improved? And what can be done differently?
We tend to ignore the bad experiments and put more emphasis on the good results, but often it’s from the mistakes that the greatest insights come.
Just like all the data generated by the experiment throughout its duration, this knowledge should be documented and shared with your team, that’s where the learning will be lapidated.
An experiment exists to generate innovation!
5 success cases
We are now going to develop the practical application of our SEO Experiment Methodology.
To show you how to apply it, I’ll expand on a few successful cases in which we have run experiments that have worked. As I said, the bad experiments are as important as the good, but the bad experiments without detailed context don’t teach very much.
1.User Experience
Challenge: To increase retention and the number of views of Conversion’s blog homepage.
Hypothesis: Bringing the most recent posts section to the first fold will increase the page’s retention rate.
Result: Success
Period: 15 days
Tools: Hotjar and Google Optimize
Our first experiment concerns the user experience within Conversion’s blog.
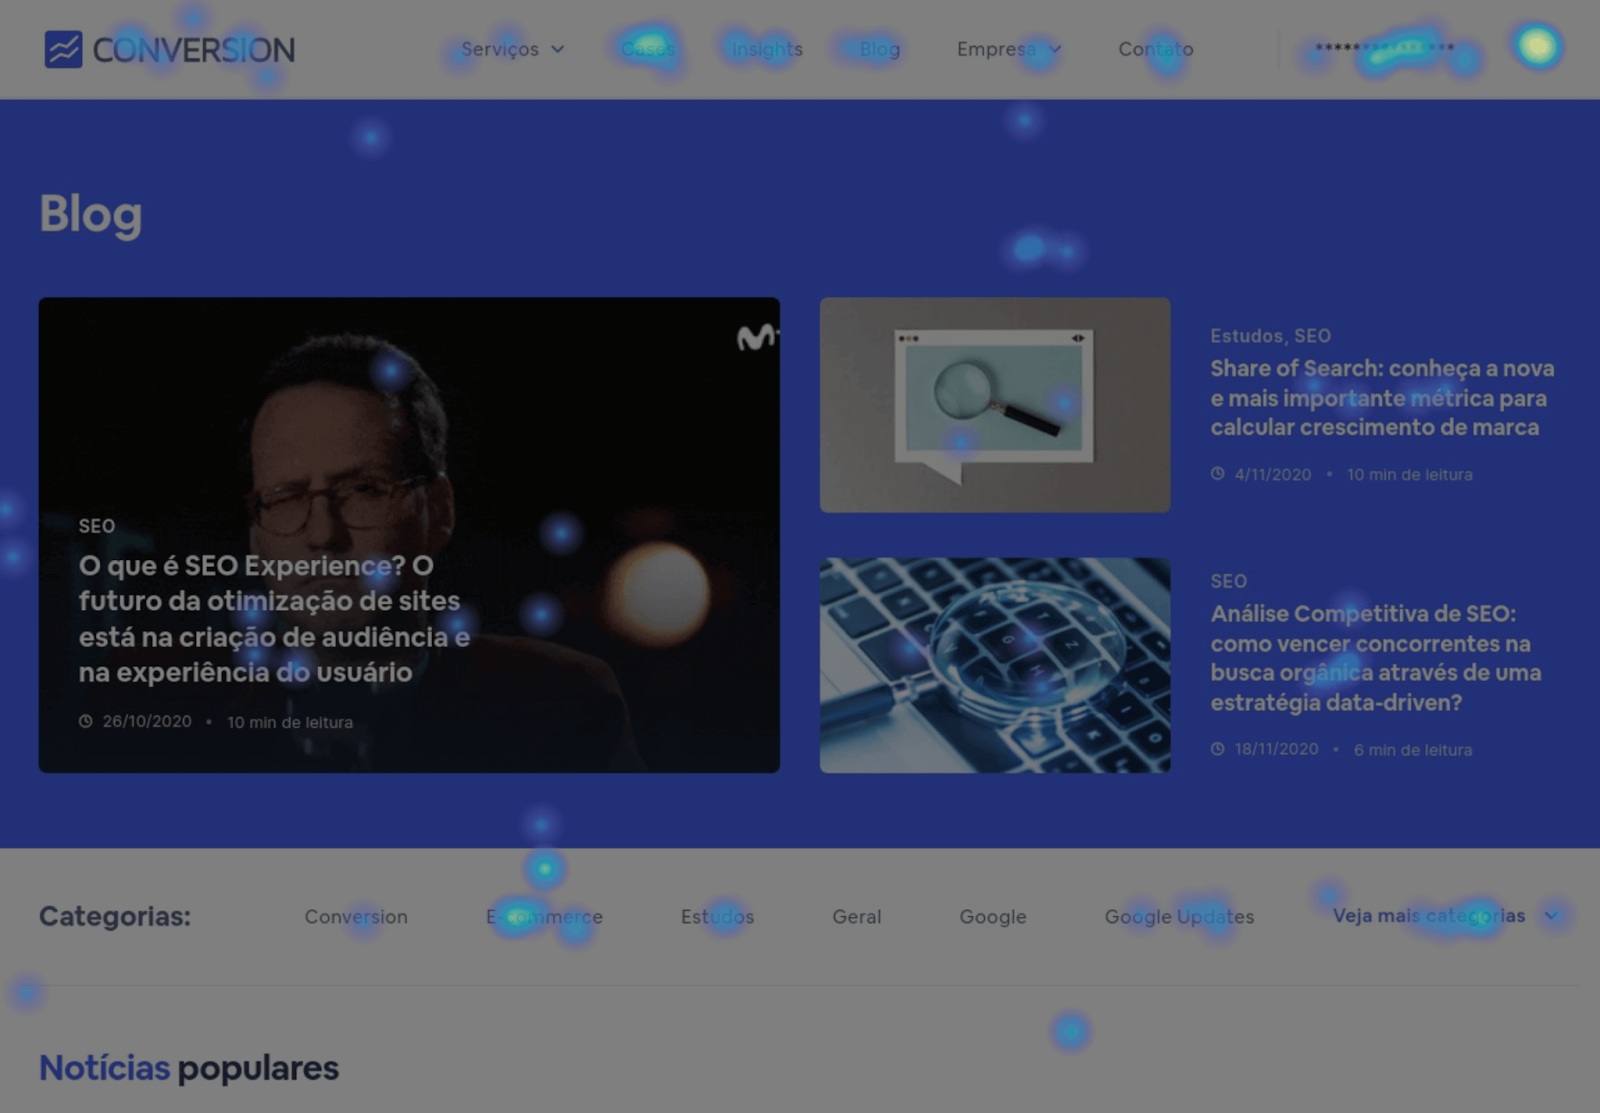
Around the beginning of January, we analyzed the home page of our blog through its click heatmap in Hotjar.
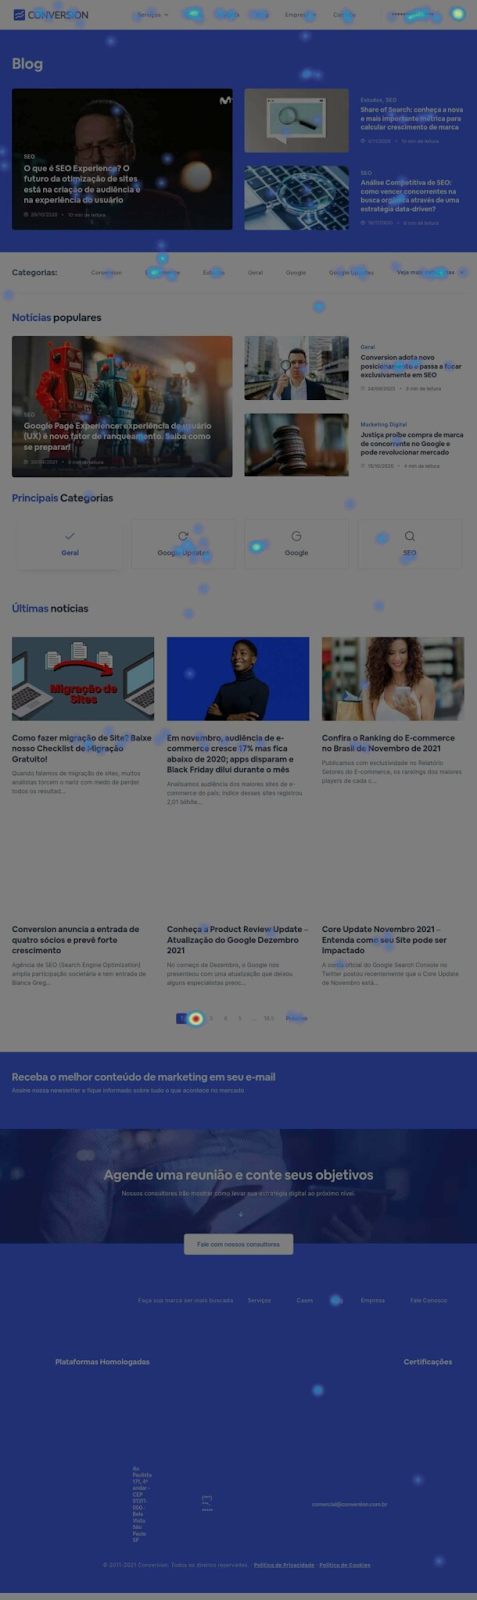
At the time, this was the structure we offered our users.
Every experiment starts with the curiosity peaked by the initial analysis.
Back to the click heatmap… we observed that there were more clicks on the blocks below the first fold than on the first part of the page.
In the first fold, the page offered a few selected studies. Further down, the most popular news, and only in the last fold, the most recent posts.
By analyzing the heatmap, it was possible to cross-reference the information and realize that, even though only 59% of the users reached the last fold, the click-through rate in this block was proportionally the highest on the whole page.
The hypothesis developed was: if the section with the recent post is shown in the first fold, there will be more clicks and users will probably spend more time on the site, which is unquestionably one of the most important metrics for SEO.
The point here is to make it possible for users to be entertained within your page. By finding what they are looking for, people tend to stay longer on the page and the site.
The opposite is also true: If they can’t find what they are looking for quickly enough, they are very likely to leave the site quickly.
For this test Google Optimize was used. Performing an A/B test with this tool is quite simple; the interface changes are made inline and any changes can be made very quickly.
See the results obtained with the change below (Variant 1).
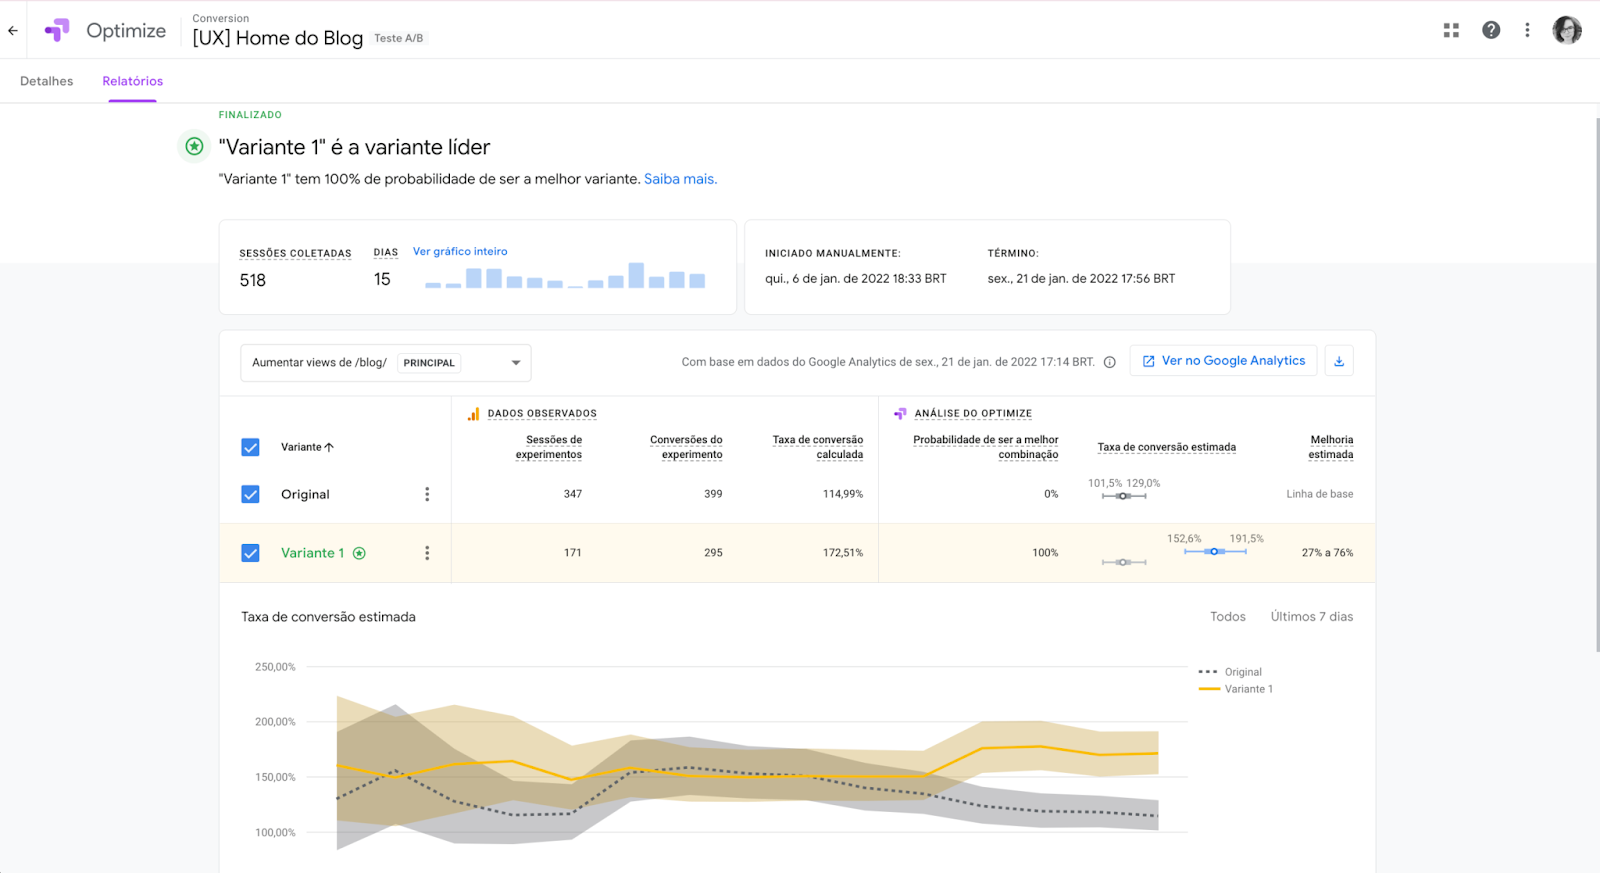
The experiment ran for 15 days and 518 sessions were collected. A small sample size, but enough for a consistent evaluation.
The main goal was to increase page/blog views on Conversion’s website.
In the experiment period, the pageviews per user increased from 1.15 to 1.72. A very positive result for the change!
The secondary goal was the increase in session duration, or retention.
Here, the jump was from 3’38” per session to 4’53”! More than a minute gain from block restructuring, an extremely impressive number.
2.Menu Label
Challenge: Improve the CTR of the button and the number of sessions on the Insights page of Conversion’s website menu.
Hypothesis: The English term is driving away users closer to the top of the funnel (keep in mind that our public is market managers from Brazil!), an audience that would precisely be more interested in the type of content presented there.
Result: Success
Period: 6 days
Tools: Hotjar and Google Optimize
In the second experiment, the object of the test was an item from our site menu labeled “Insights”. We ran this experiment for just 6 days, because we had such good results and high confidence level (please read about the Bayesian statistical model used by Google Optimize).
Let’s go back, again, to our click heatmap:
Of all the links on our menu, the one with the lowest click-through rate is “Contact”.
This is expected, but what was not expected was that our “Insights” page, our richest content, would have a similar, low click-through rate.
The experiment, then, was to rename the menu label to “Rich Content” (“Conteúdos Ricos”, in Portuguese). The experiment ran in Optimize for 6 days and collected 2,366 sessions.
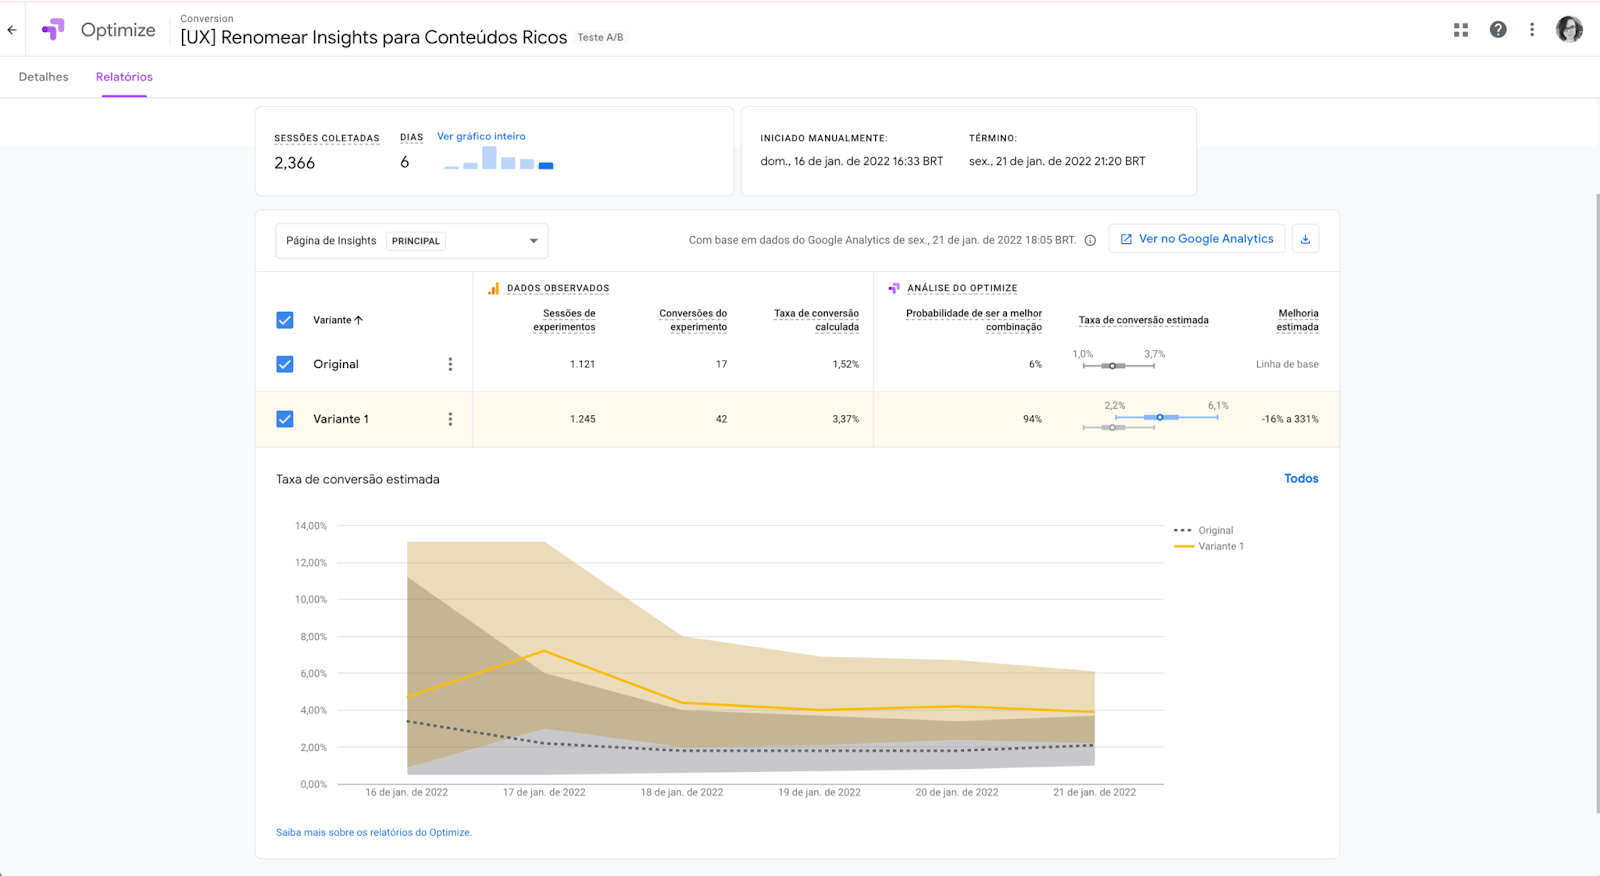
At the end of the stipulated period, the CTR went from 1.52% to 3.37%, a more than substantial jump!
When running this test, no secondary metrics were stipulated. However, if we were to re-run it today, we would stipulate, for example, some metrics such as session duration, number of pages per session, etc.
This was also a great learning experience. Because it reaffirms how small elements can be major agents of change.
4.Conversion Rate Optimization (CRO)
Challenge: To improve Conversion’s homepage conversion rate.
Hypothesis: The copy “Unlock organic search potential with Brazil’s leading SEO agency” is not very persuasive and is not directly related to the client’s pain or desire.
Result: Success
Period: 14 days
Tools: PageSense
The third success case is related to conversion at the Conversion site (lead gain).
This experiment was run on the PageSense tool with an A/B test and documented in Notion according to the organization described at the beginning of this content.

First, the main goal was to improve the conversion rate on the Home page.
The hypothesis was that the title “Unlock organic search potential with Brazil’s leading SEO agency” was unpersuasive and had no direct relation to the client’s real pain or desire.
The experiment consisted of changing the copy to what we see below:

After: It’s time to crush the competition in organic search. Partner with the biggest SEO Agency in Brazil.
Before: Unlock organic search potential with Brazil’s leading SEO agency”
The final conversion was lead generation – form submission on the Contact page -, and the micro-conversion was the viewing of this same page.
Let’s go to the results.
The conversion rate from Home to viewing the “Contact” page jumped from 5.43%, which was already a good number, to 7.42%!
The conversion rate from lead generation, which was our main goal, jumped from 1.21% to 2.42% (doubled)!
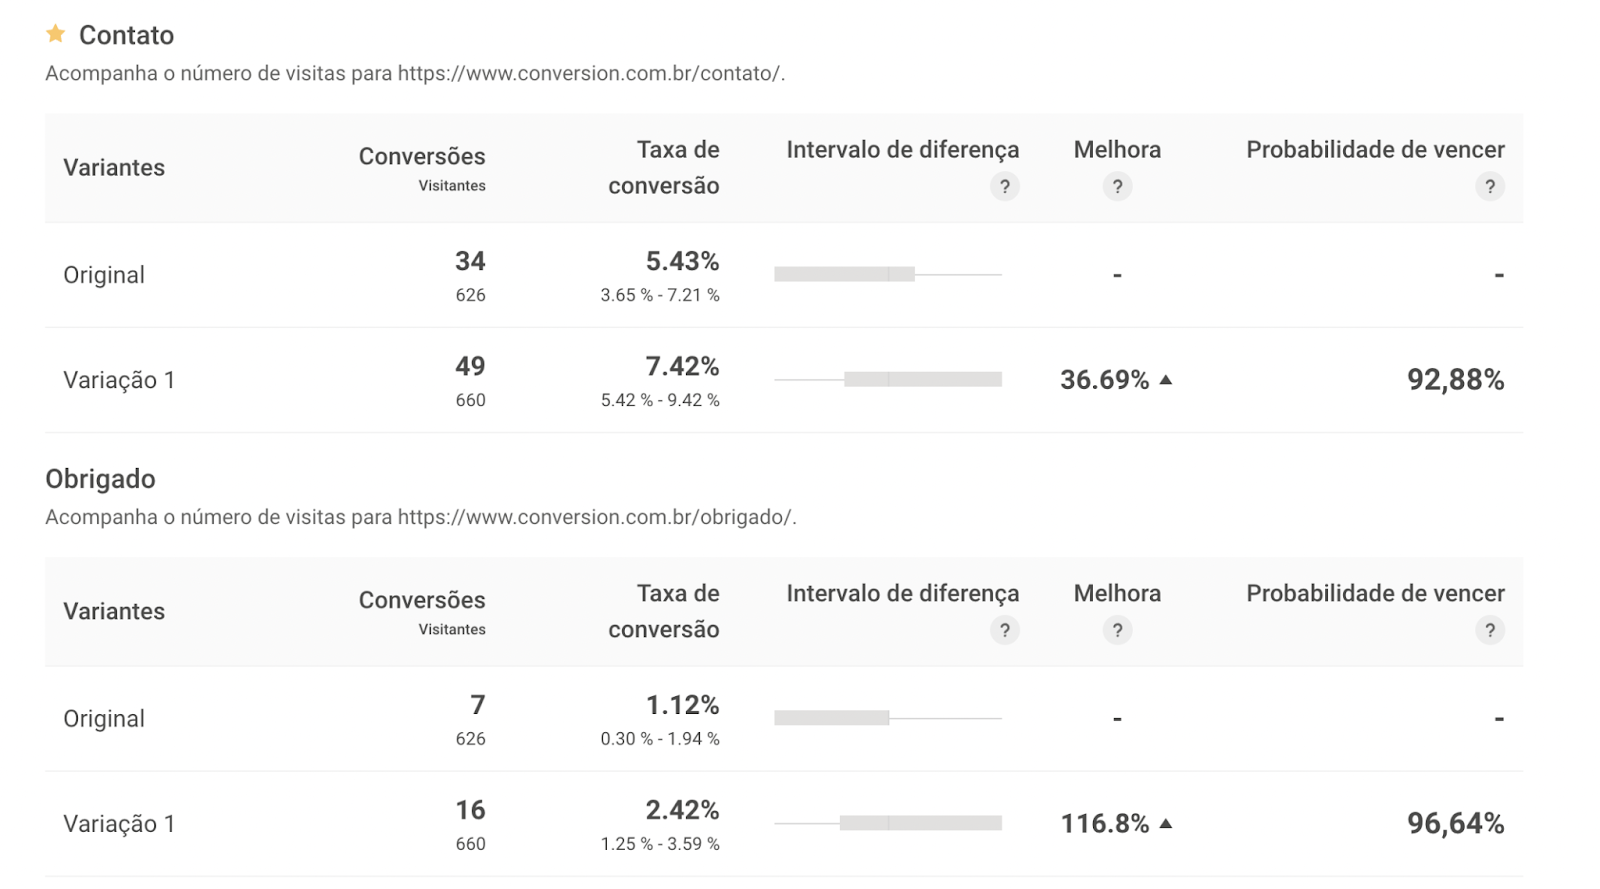
The results were nothing short of excellent!
4. Technical SEO
Challenge: Taking our page “SEO Guide 2022” from the second to the first page of Google, by adding internal links.
Hypothesis: Adding 10 internal links would take the “SEO Guide 2022” content page from the second to the first page of Google for “SEO” keyword, and keep it there.
Result: Success
Period: 24 Days
Tools: Ahrefs
In SEO, there has always been a lot of talk about internal links and how a good internal linking scheme is able to leverage the authority of a given page.
To confirm this theory, we brought you an experiment on internal links.
Here is how it was documented:
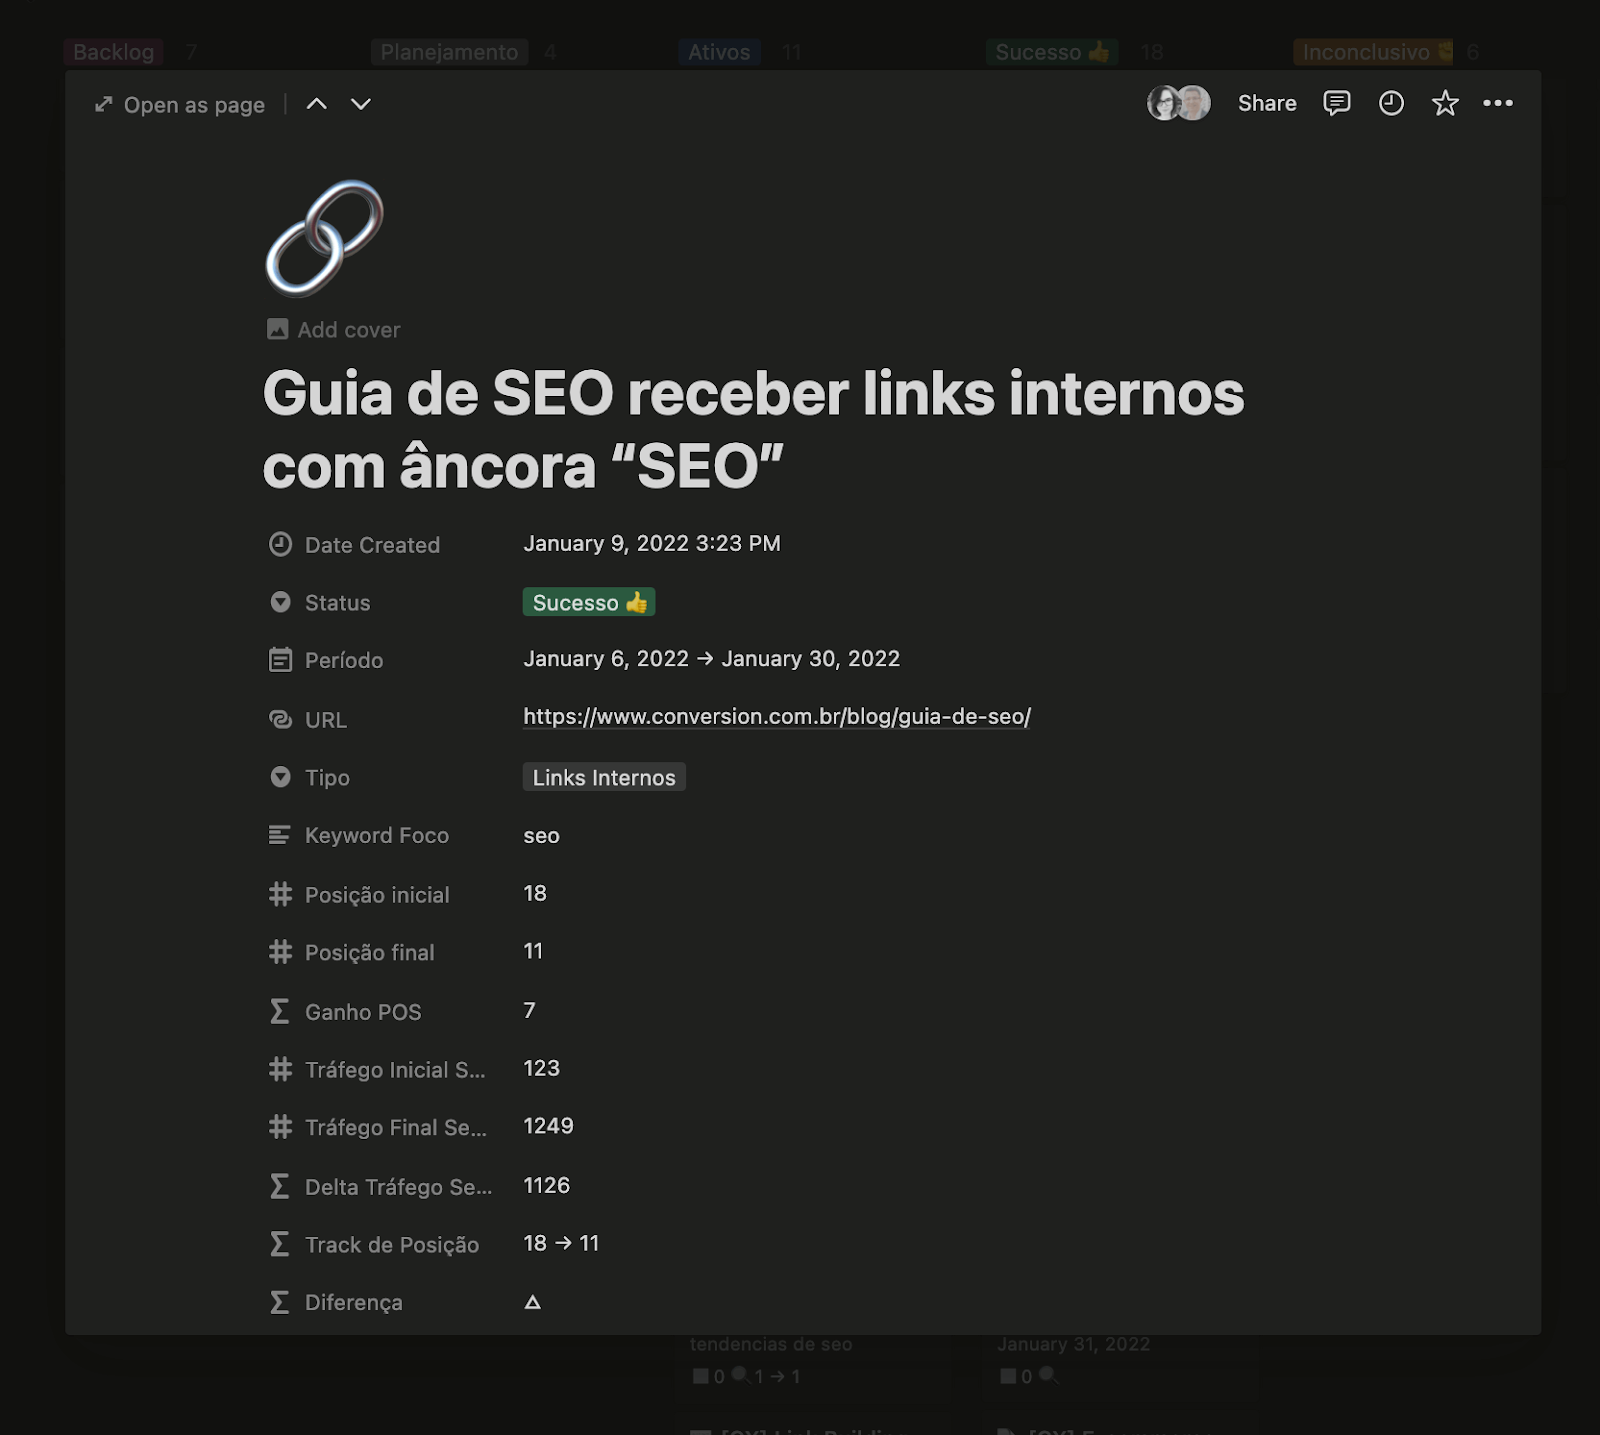
We documented the following:
- What is the type of Experiment;
- Initial position of the SEO keyword in Google at the beginning of the period;
- Initial traffic to the page at the beginning of the period, in SEMRush.
- The challenge was to optimize a page for the keyword [SEO].
In a previous experiment we reached the second page of Google by optimizing the content. By adding internal links we hoped to reach the first page.
At the beginning, according to Ahrefs the page was receiving 8 internal links, including image links. It was in 18th position on the SERP for the keyword [seo].
The hypothesis stipulated that adding relevant internal links with the SEO anchor from better ranked pages when searching for [seo site:conversion.com.br] could help the positioning of the URL in question.
The experiment ran for 24 days and a total of 11 internal links were created.
At the end of the period, the page had gained 8 organic positions for the keyword [seo].
This test showed how a relatively simple optimization can have a great effect.
After the experiment, the keyword continued to rank between 8th and 14th positions in the SERP, which raised a second hypothesis: that the page may be technically fine, but the content could perhaps be improved.
This insight was the seed for our next experiment.
5. Content Experience
Challenge: To improve the content of the page “SEO Guide 2022” to increase its retention rate and thus sustain a position on the first page of Google.
Hypothesis: Structural improvements within the text will make the content more attractive and improve its retention rate, fixing the content on the first page of Google.
Result: Success
Period: 30 days
Tools: Retention Analysis Worksheet and Clarity
The fifth and last experiment is a Content Experience experiment. Content Experience is about how users engage with content.
We used this example especially because in this case it was running together with another 301 Redirect Experiment, but this is not a practice we recommend you to repeat.
The 301 Redirect Experiment was about redirecting URLs that were receiving links related to SEO from other domains.
When two experiments run simultaneously on a single page, you lose control over which one is having the greatest effect, whether good or bad.
Another scenario is that one experiment is successful while the other is unsuccessful. In this case one action can cancel out the other, preventing the page from making significant gains.
Even so, we decided to run this as a conceptual test, and moreover, an “experimental experiment”.
This experiment was also done on our SEO Guide 2022 page, which, as you saw a few lines above, reached the first page after receiving some internal links.
The first step was to analyze the heatmap and calculate the retention of the content.
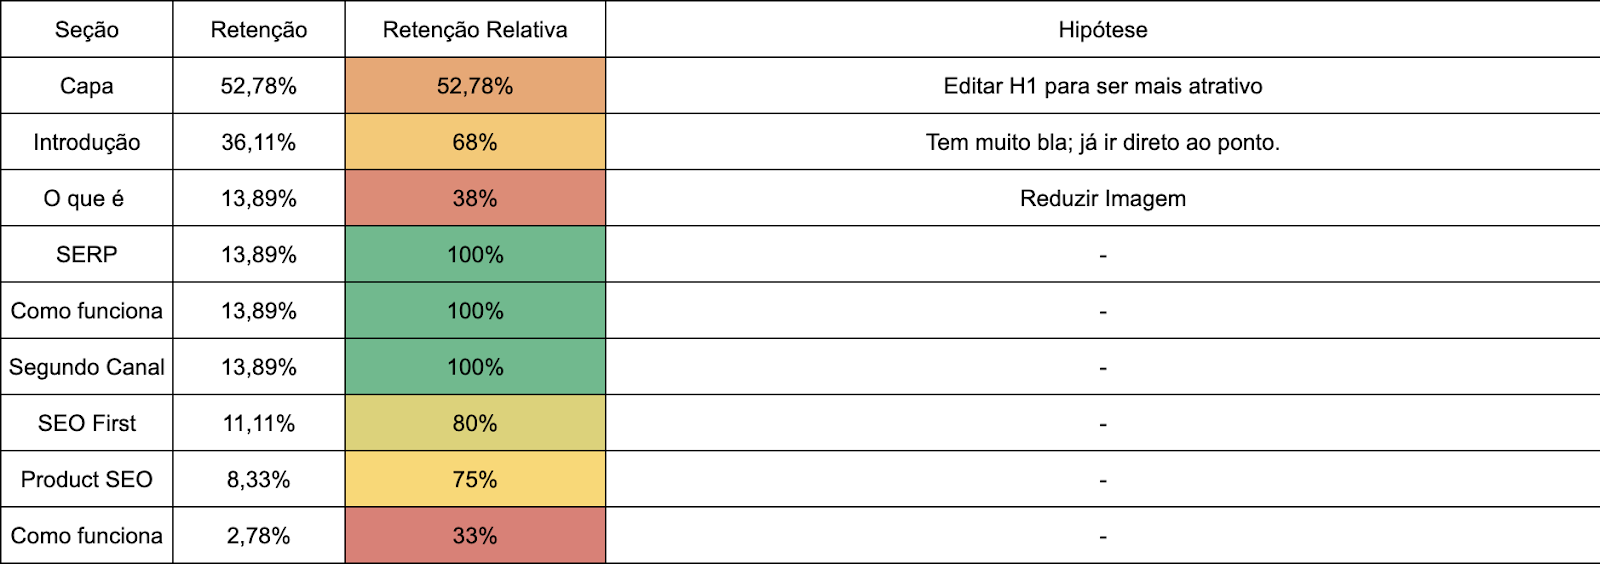
Translation: Hypothesis Column: Row 1: Edit H1 to be more curious; Row 2: Go straight the point; Row 3: remove image;
We can observe that the content suffers significant retention drops in the first blocks of text.
We also observed that the content that was ranking in the first position for the [seo] term in the SERP was much simpler and more practical.
The hypothesis, therefore, was that small improvements in the text blocks that were losing the most users could increase the retention of the page and maintain it on the first page of Google.
To better document the changes, I created the table below as a basis for comparison. On the left, what it looked like in the beginning; on the right, what it looked like after the changes.

The changes were:
- Replacement of the H1 for a more attractive title;
- Reduction of the text introduction, taking the user straight to the main information;
- Removal of the introductory image;
- Changing the current thumbnail for an image more related to the post theme.
The result of this experiment was fantastic! You can check that page here (in Portuguese), but keep in mind that we’re constantly running new experiments to improve user experience and ranking factors.
Check out the retention analysis spreadsheet after the changes:
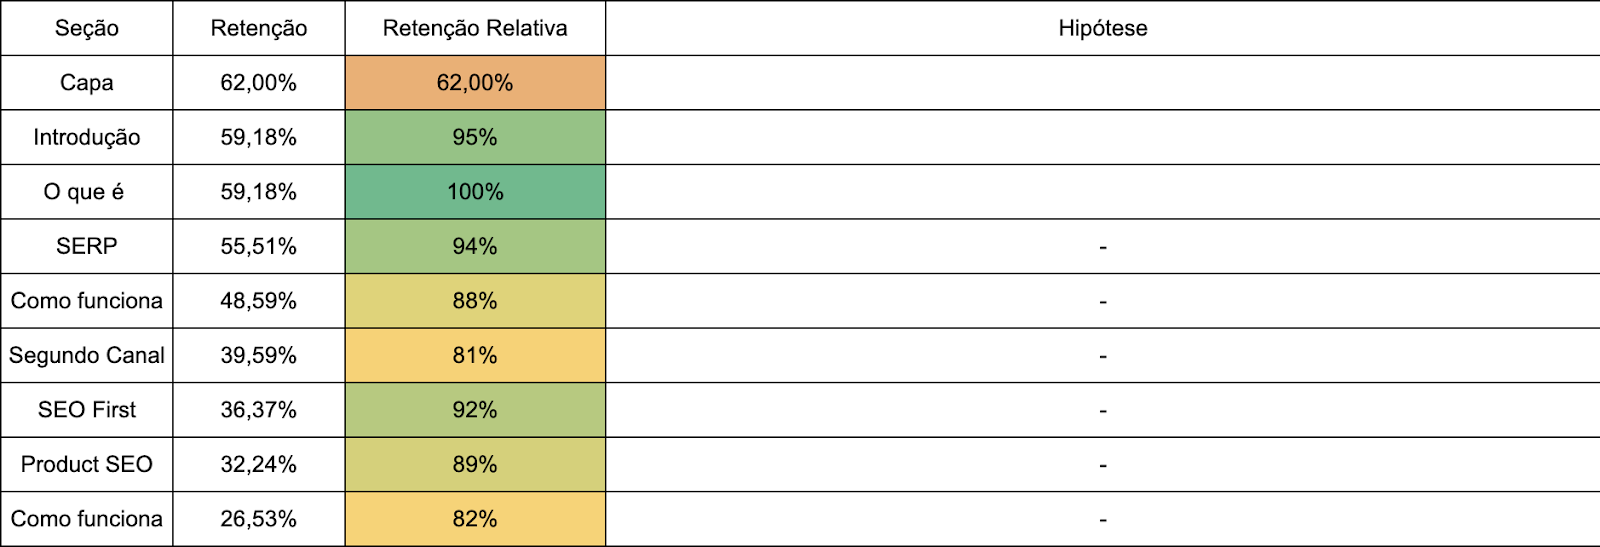
It’s absolutely amazing: After the experimentation period, the page rose from 11th to 5th position on the SERP!
In some cases relative retention dropped because in previous blocks the relative and total retention increased significantly.
This gain becomes even more significant if we consider that in the first experiment done for that page, it was in 18th position on the SERP.
The big takeaway from this experiment is that the more useful a content is to the user, the better it will rank on Google’s search results.
Conclusion
I’ve shared a few of the hundreds of experiments we’ve done over the last months. The biggest lesson from doing experiments is not about the great results you can get from them (of course, that’s amazing!), but the culture of testing and learning from errors.
The knowledge generated by the tests are helping our team very much to develop a culture of experimentation, valuing the errors and sharing successful or unsuccessful tests. When you work with curious people they take this knowledge and adapt to problems they have to resolve. The culture of testing is something you start but never finish.
Last, but not least, almost every experiment I run confirms that SEO is not about technical changes, but about user experience improvement. Connect these dots and you’ll undoubtedly dominate Search Engines!